MedalMosaic
A Data Exploration Tool Unveiling 120 Years of Olympic Data
Using Olympics data of over 120 years, ranging from the 1896 Athens Games to the 2016 Rio Games, I have designed 5 dynamic graphs on a dashboard.
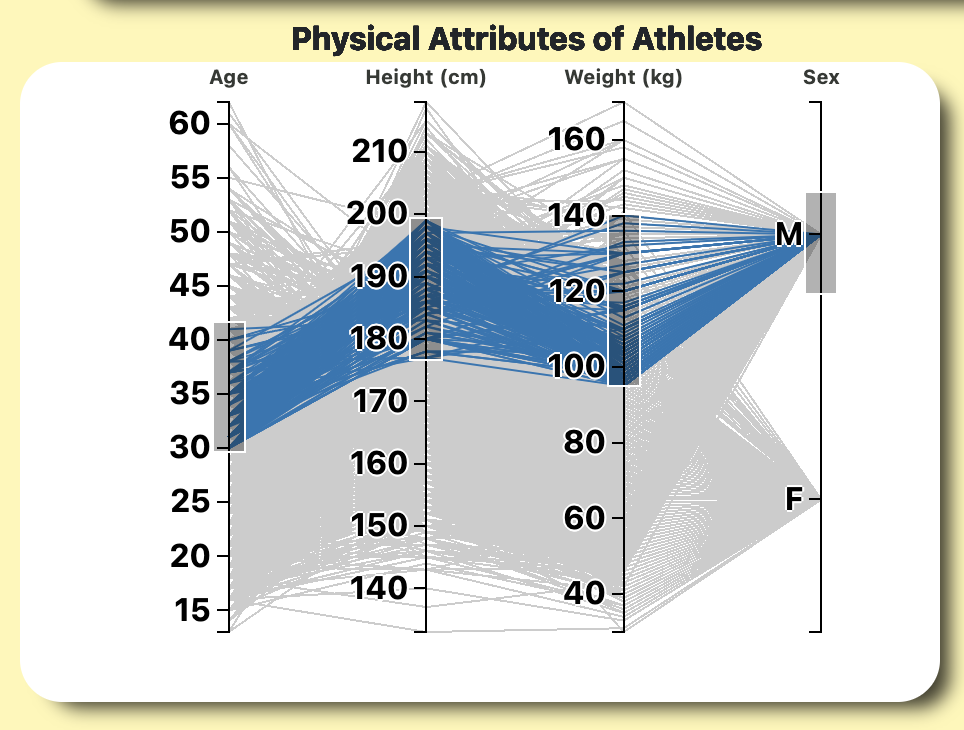
The interactivity elements present on the dashboad enable the user to change the parameters like Year, Countries, Height, Weight, Gender, etc. By doing so, the user can get interesting insights into athlete performance in a particular sport or year, or how different countries perform in different sporting events.


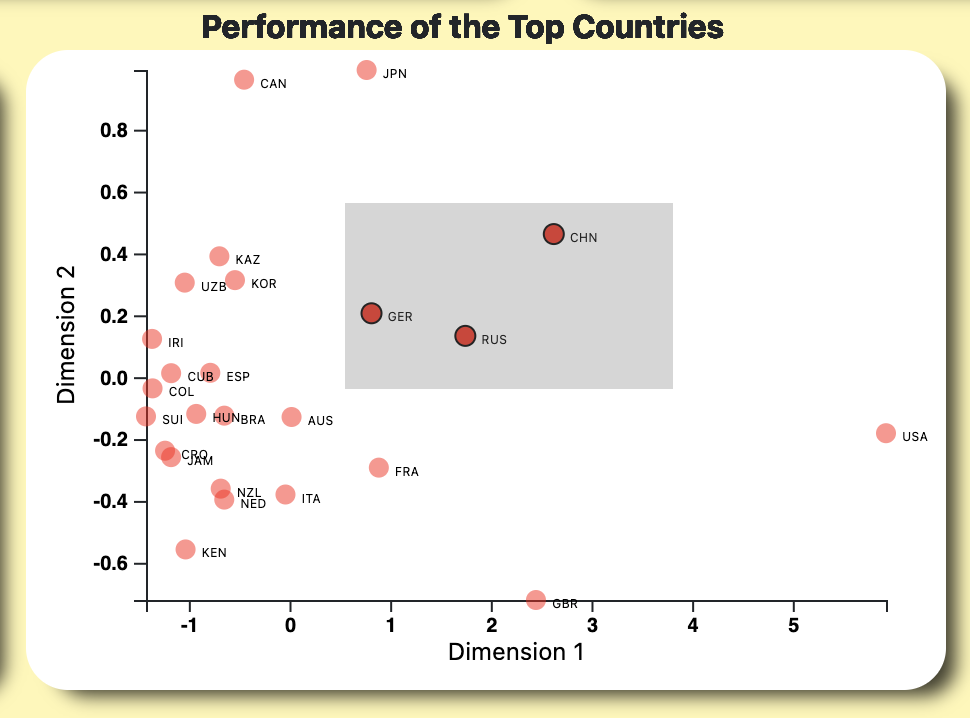
On the left, a choropleth showing participation from various countries. Middle, a bar chart showing sport wise participation. Right, PCA scatterplot showing relative performance of top 25 countries of that year.

The complete dashboard!
Interactivity elements in the dashboard are included in the PCA scatterplot and the Parallel Co-ordinates plot:


Video to the demonstration of my dashboard!